Stop losing money on returnsKnow exactly what to fix
Upload your orders and returns data. Retenza identifies which products are driving the most return loss, why customers return them, and how to fix the root causes.


3 simple steps
Upload your data, find what drives return loss, and fix what matters most.
- 1
Upload orders and returns
Add your orders and returns files. Include products for richer SKU and category insights.
- 2
Find what drives return loss
Retenza matches returns to orders, quantifies return loss by SKU, and reveals the top reasons customers send products back.
- 3
Take action on root causes
Get a ranked action plan so your team can reduce returns and protect margin faster.
What You Get with Retenza
Everything you need to find return-loss drivers and fix them faster.
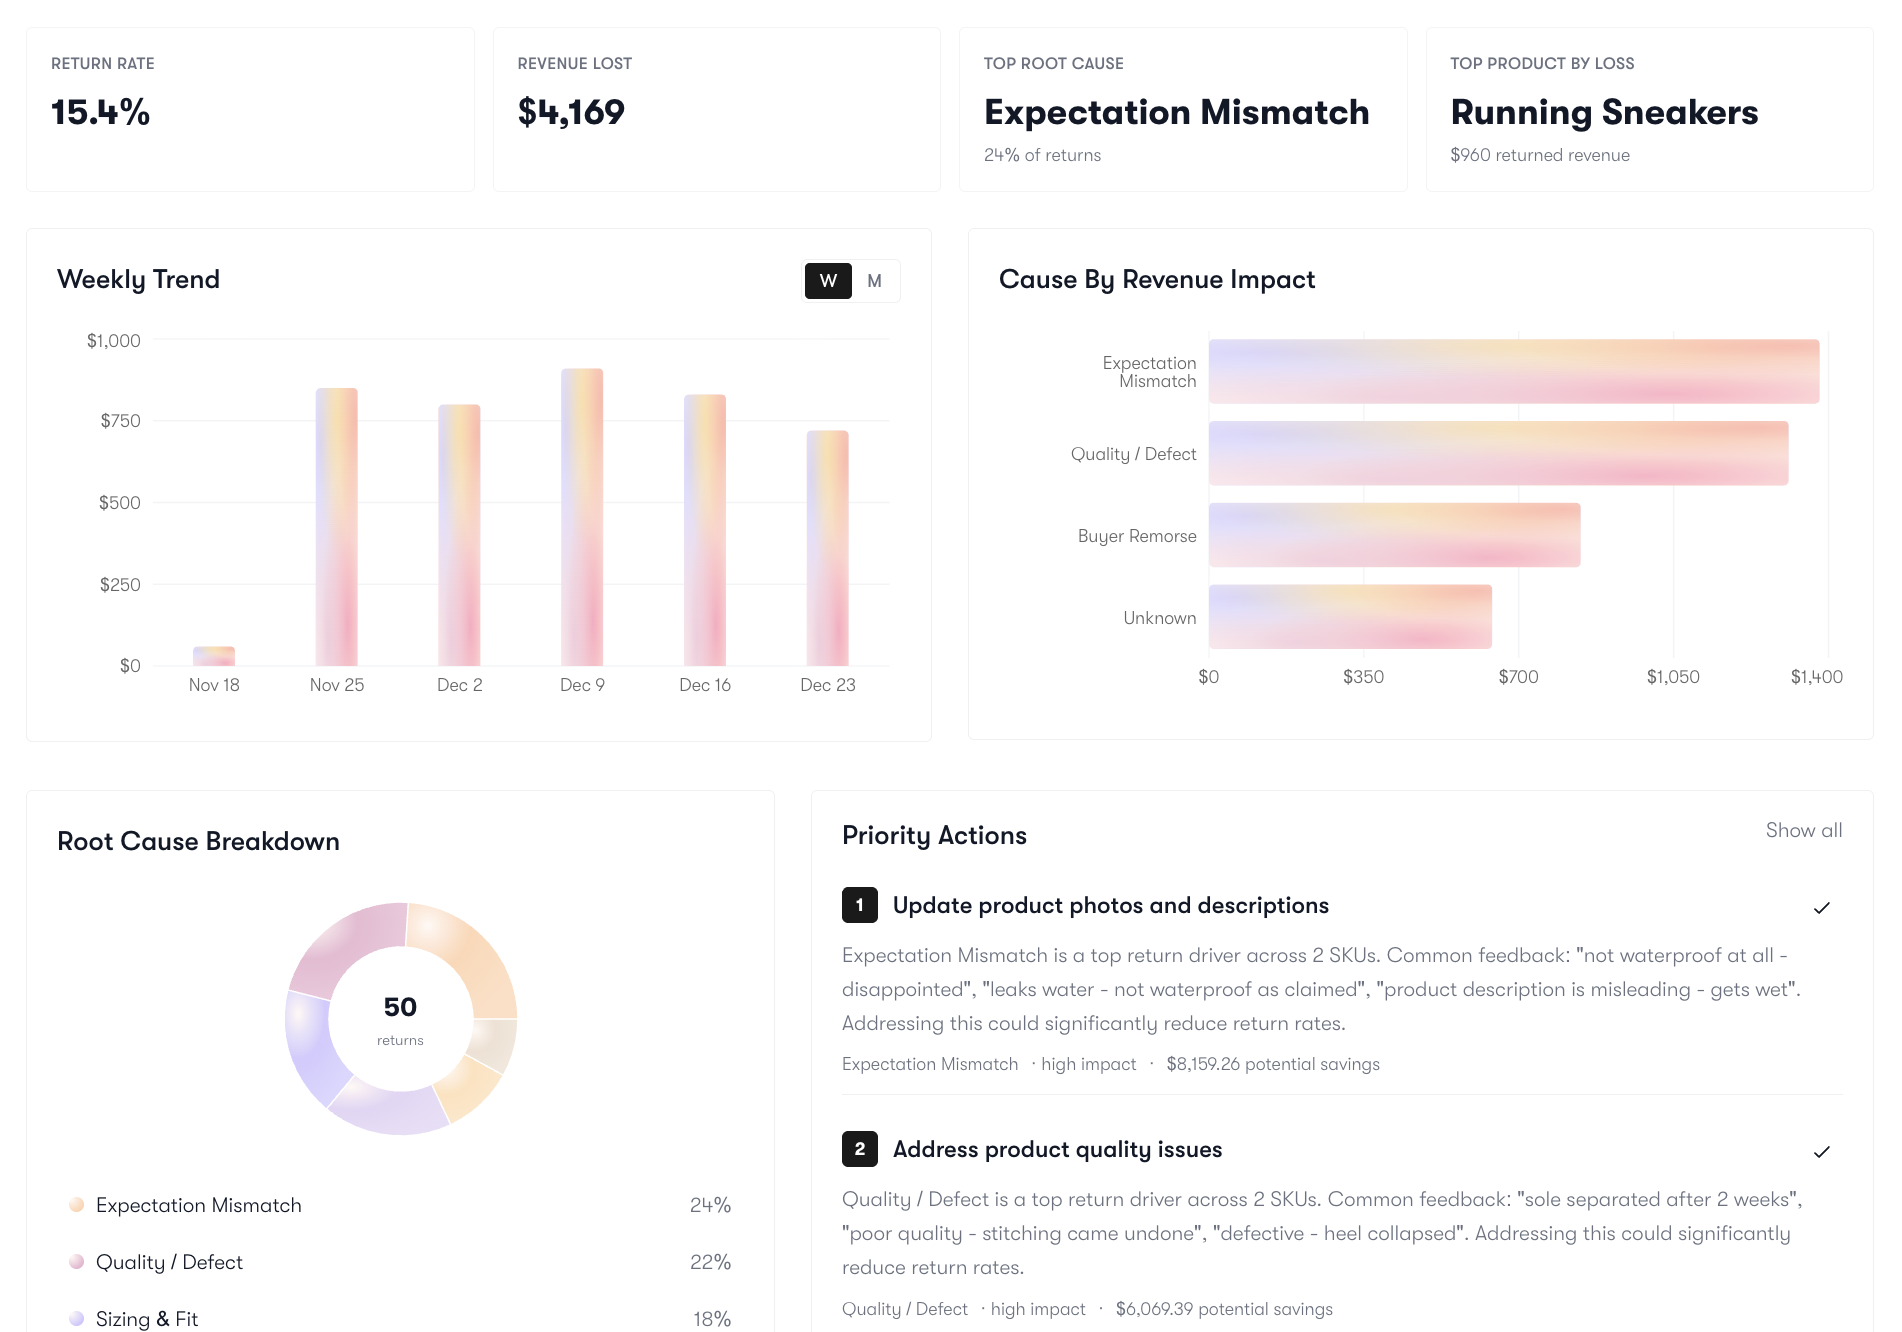
Return-loss dashboard
See return rate, revenue at risk, top root cause, and highest-loss SKU at a glance.
Loss trends over time
Track how return loss changes week to week and spot where it is getting worse.
Top return reasons
See the biggest reasons customers send products back and where to focus first.
Prioritized action plan
Get ranked next steps so your team starts with the highest-impact fixes.
SKU risk leaderboard
Find products driving the most return loss with rate and revenue impact in one view.
Deep SKU insights
Drill into variants, customer signals, and recommended fixes for each SKU.
Simple and Transparent Pricing
Start free. Unlock full analysis when you are ready.
Preview of Analyses
- Upload and validate your CSV
- Quick summary snapshot
- Top 2 actions + top 3 SKUs
- Basic root-cause preview
Full Analysis Unlock
- Unlimited actions and full SKU leaderboard
- Deep SKU insights with evidence snippets
- Variant-level issue and return pattern analysis
- AI-generated fix ideas for each priority SKU
- Full trend, revenue-loss, and root-cause dashboards
- Focused plan of highest-impact improvements
One-time unlock. No recurring subscription.
Cut return losses and protect your margins
Upload your orders and returns, see exactly which SKUs are costing you the most, and get a clear plan to fix them.